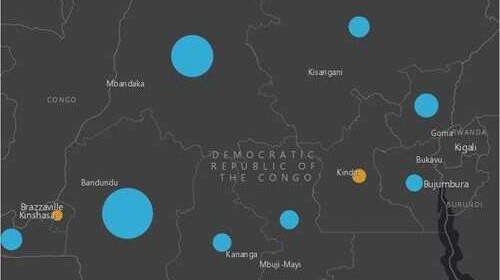
To gather intelligence on where prevention and aid are most needed, and to calculate the incidence rate per 1,000 for SDG reporting, you'll map the spatial and temporal distribution of malaria from 2000-2015.
Offered by

Related
Citizen science data to track SDG progress
Resource
Document
Offered by:
Elena Proden (UNITAR, coordinator), Karen Bett (GPSDD), Jillian Campbell (CBD), Haoyi Chen (UNSD), Sara Duerto Valero (UN Women), Dilek Fraisl (IIASA), Gabriel Gamez (UNSD), Stephen MacFeely (WHO), Yongyi Min (UNSD), Rosy Mondardini (CSCZ), and Linda See (IIASA).
Crowd4SDG, CSCZ, GPSDD, IIASA, WHO, UNITAR, UN Women, UNSD

National Superheroes office – Episode 2: Are the health data right?
Microlearning
Video
Offered by:
UNITAR, UNSD
Computation of the SDG indicators 3.4.1, 3.8.1, 3.c.1 and 6.3.1
Microlearning
Video
Offered by:
WHO, UNITAR