Urban hot spots are in the context of the present guide understood as locations with rapid increase of artificial surfaces/built-up areas. The guide shows how to identify and visualize such locations on maps.
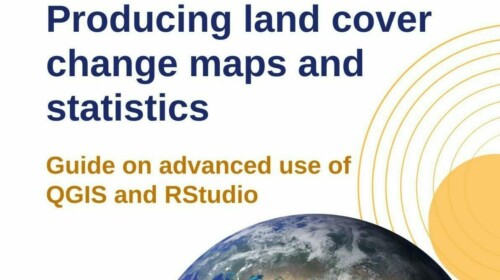
The guide explains the use of open-source software, namely Quantum Geographic Information System (QGIS) to construct a map displaying the rate of increase of artificial surfaces in a geographical area over time. Maps are generated in accordance with the land cover category built-up area of the European Space Agency (ESA) land cover classification, which corresponds to the land cover category artificial surfaces (which includes urban and associated areas) of the System of Environmental-Economic Accounting (SEEA).
Note the guide shows how to illustrate gross increases in artificial surfaces; it does not take into account decreases in artificial surfaces. As decreases in artificial surfaces, i.e. conversions of artificial surfaces to natural surfaces are rare, this should have minor to no impact on the resulting illustrations.